Usage: the infrastructure meter
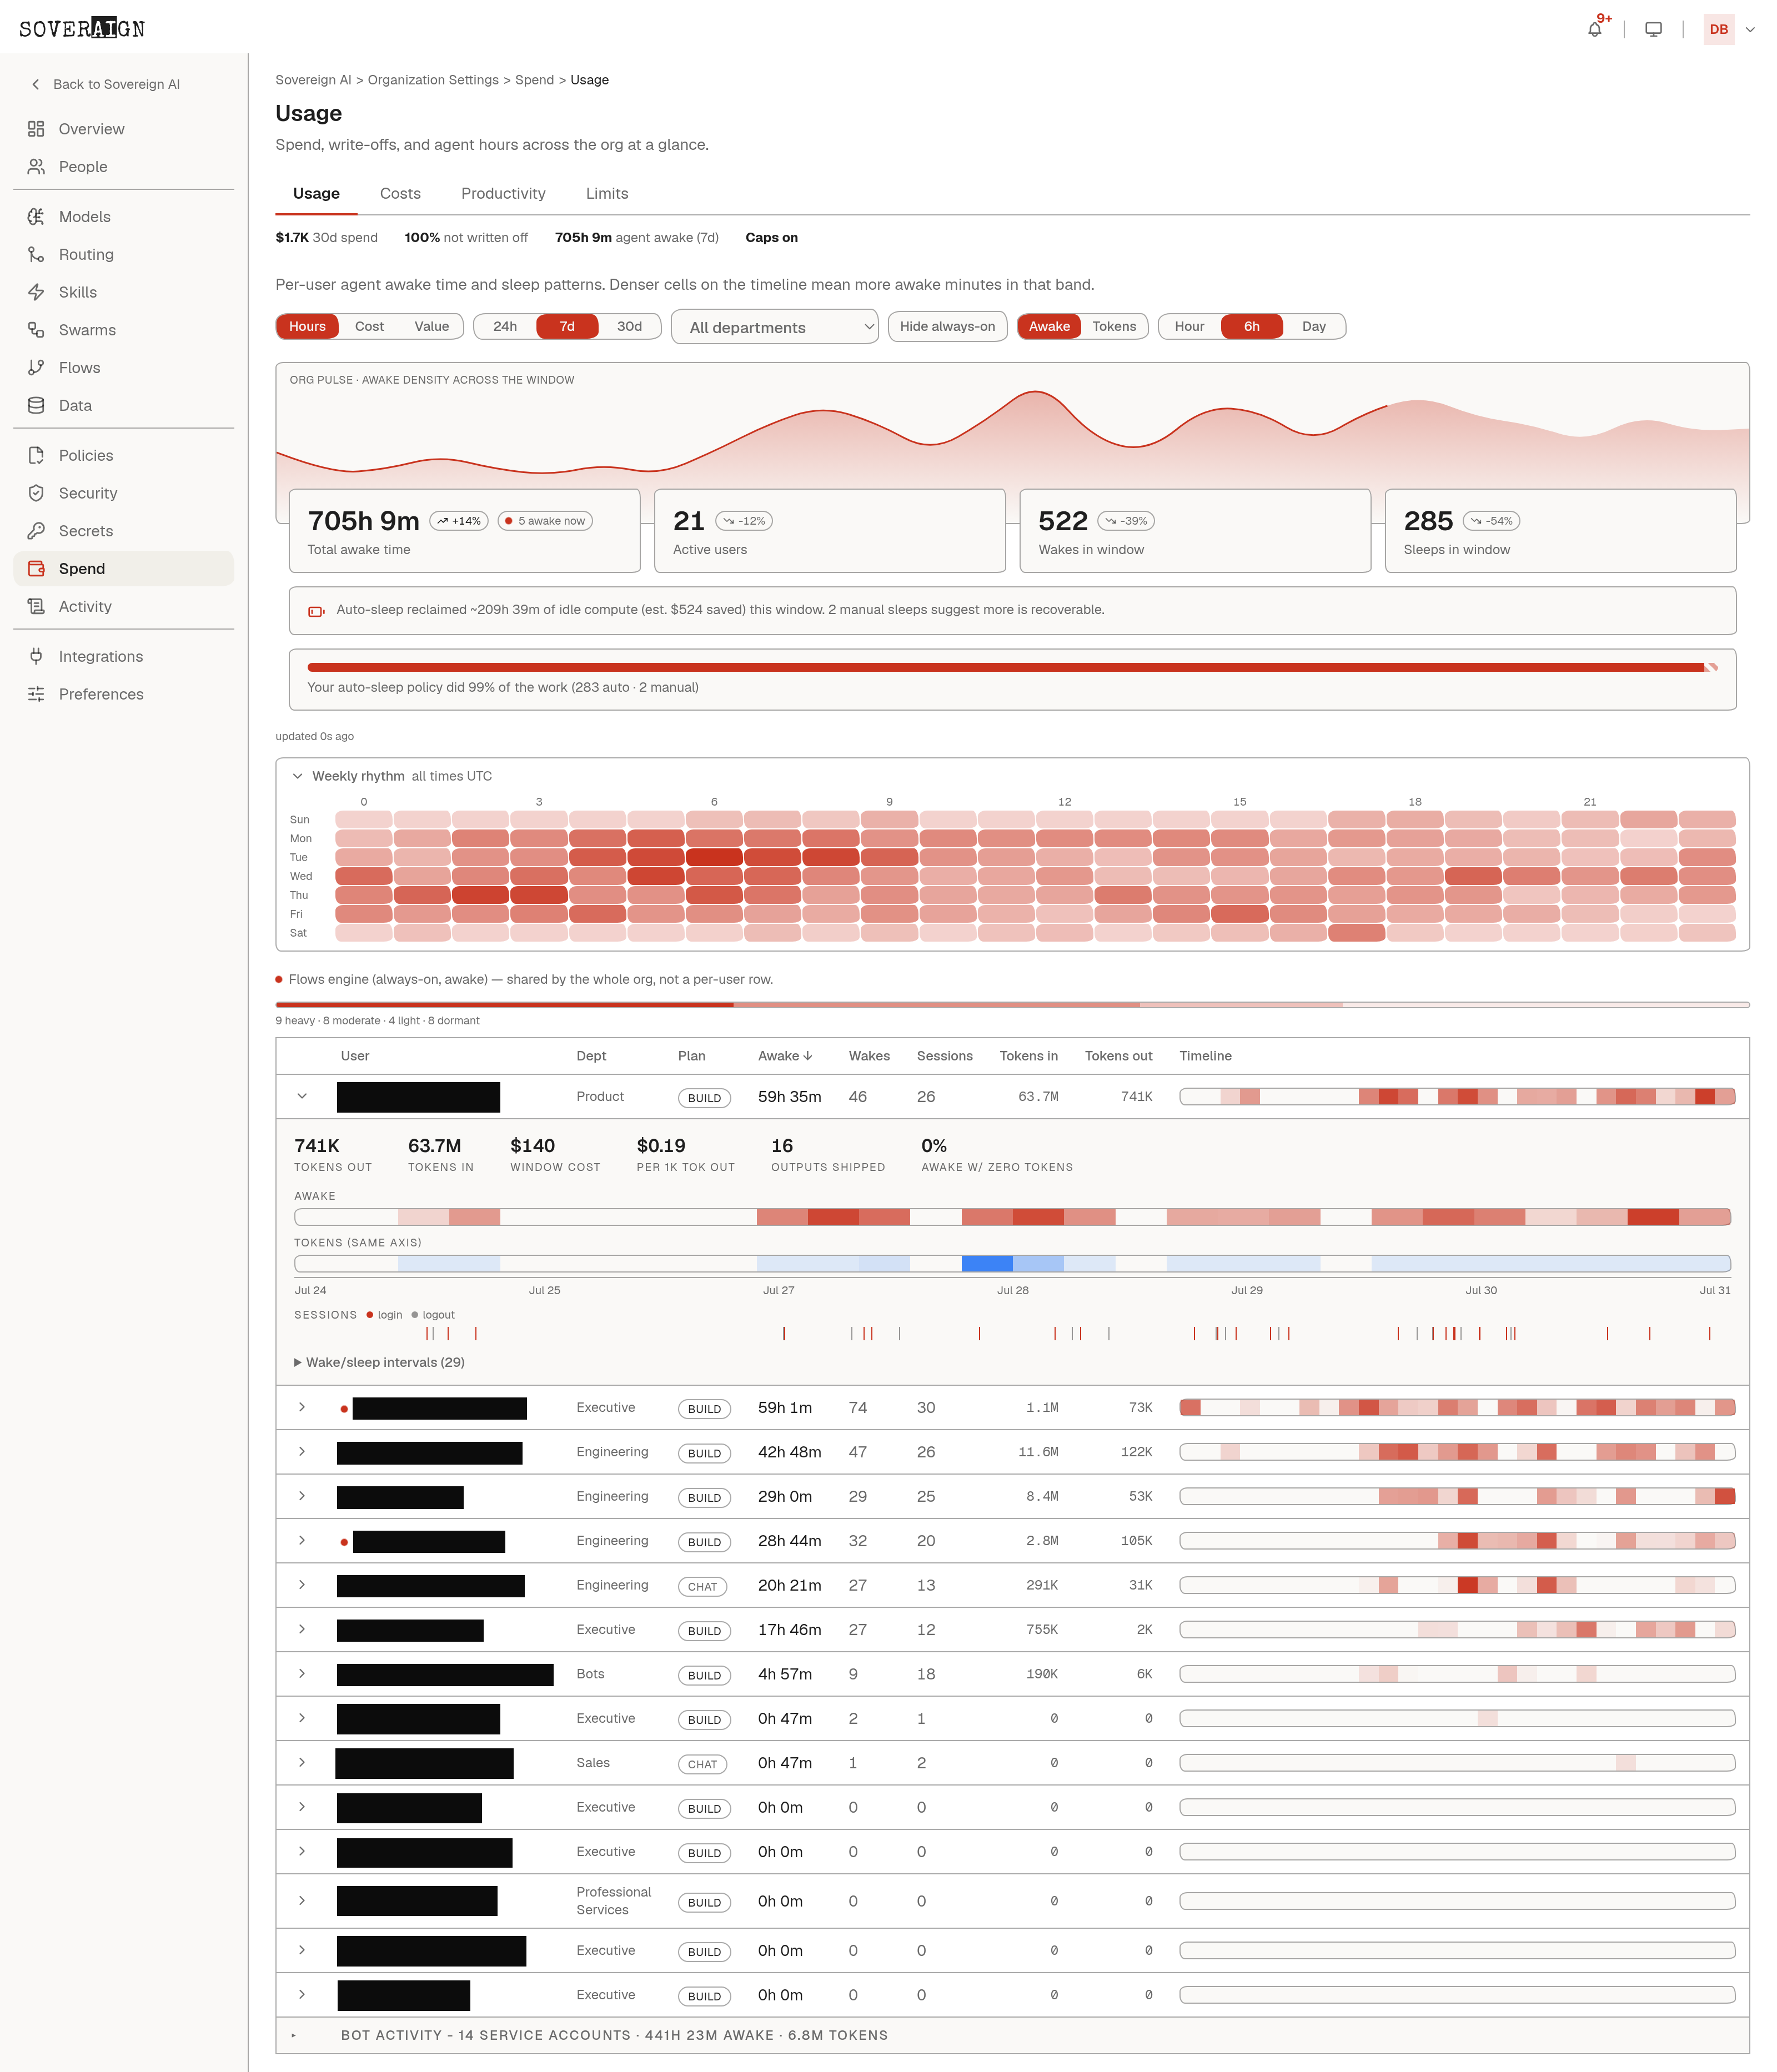
The first tab meters infrastructure. Per-user agent awake time and sleep patterns: the org pulse chart, total awake hours with awake-now presence, wakes and sleeps in the window, and a weekly rhythm heatmap of when instances are actually on. Lenses switch between Hours, Cost (awake time priced at the org compute rate), and Value (usage attributed to swarms, flows, and chat). Auto-sleep does the saving and the page quantifies it: idle compute reclaimed, dollars saved, and how much of the work the policy did on its own. Sleeping instances are deallocated and accrue nothing.
Costs: the AI token meter
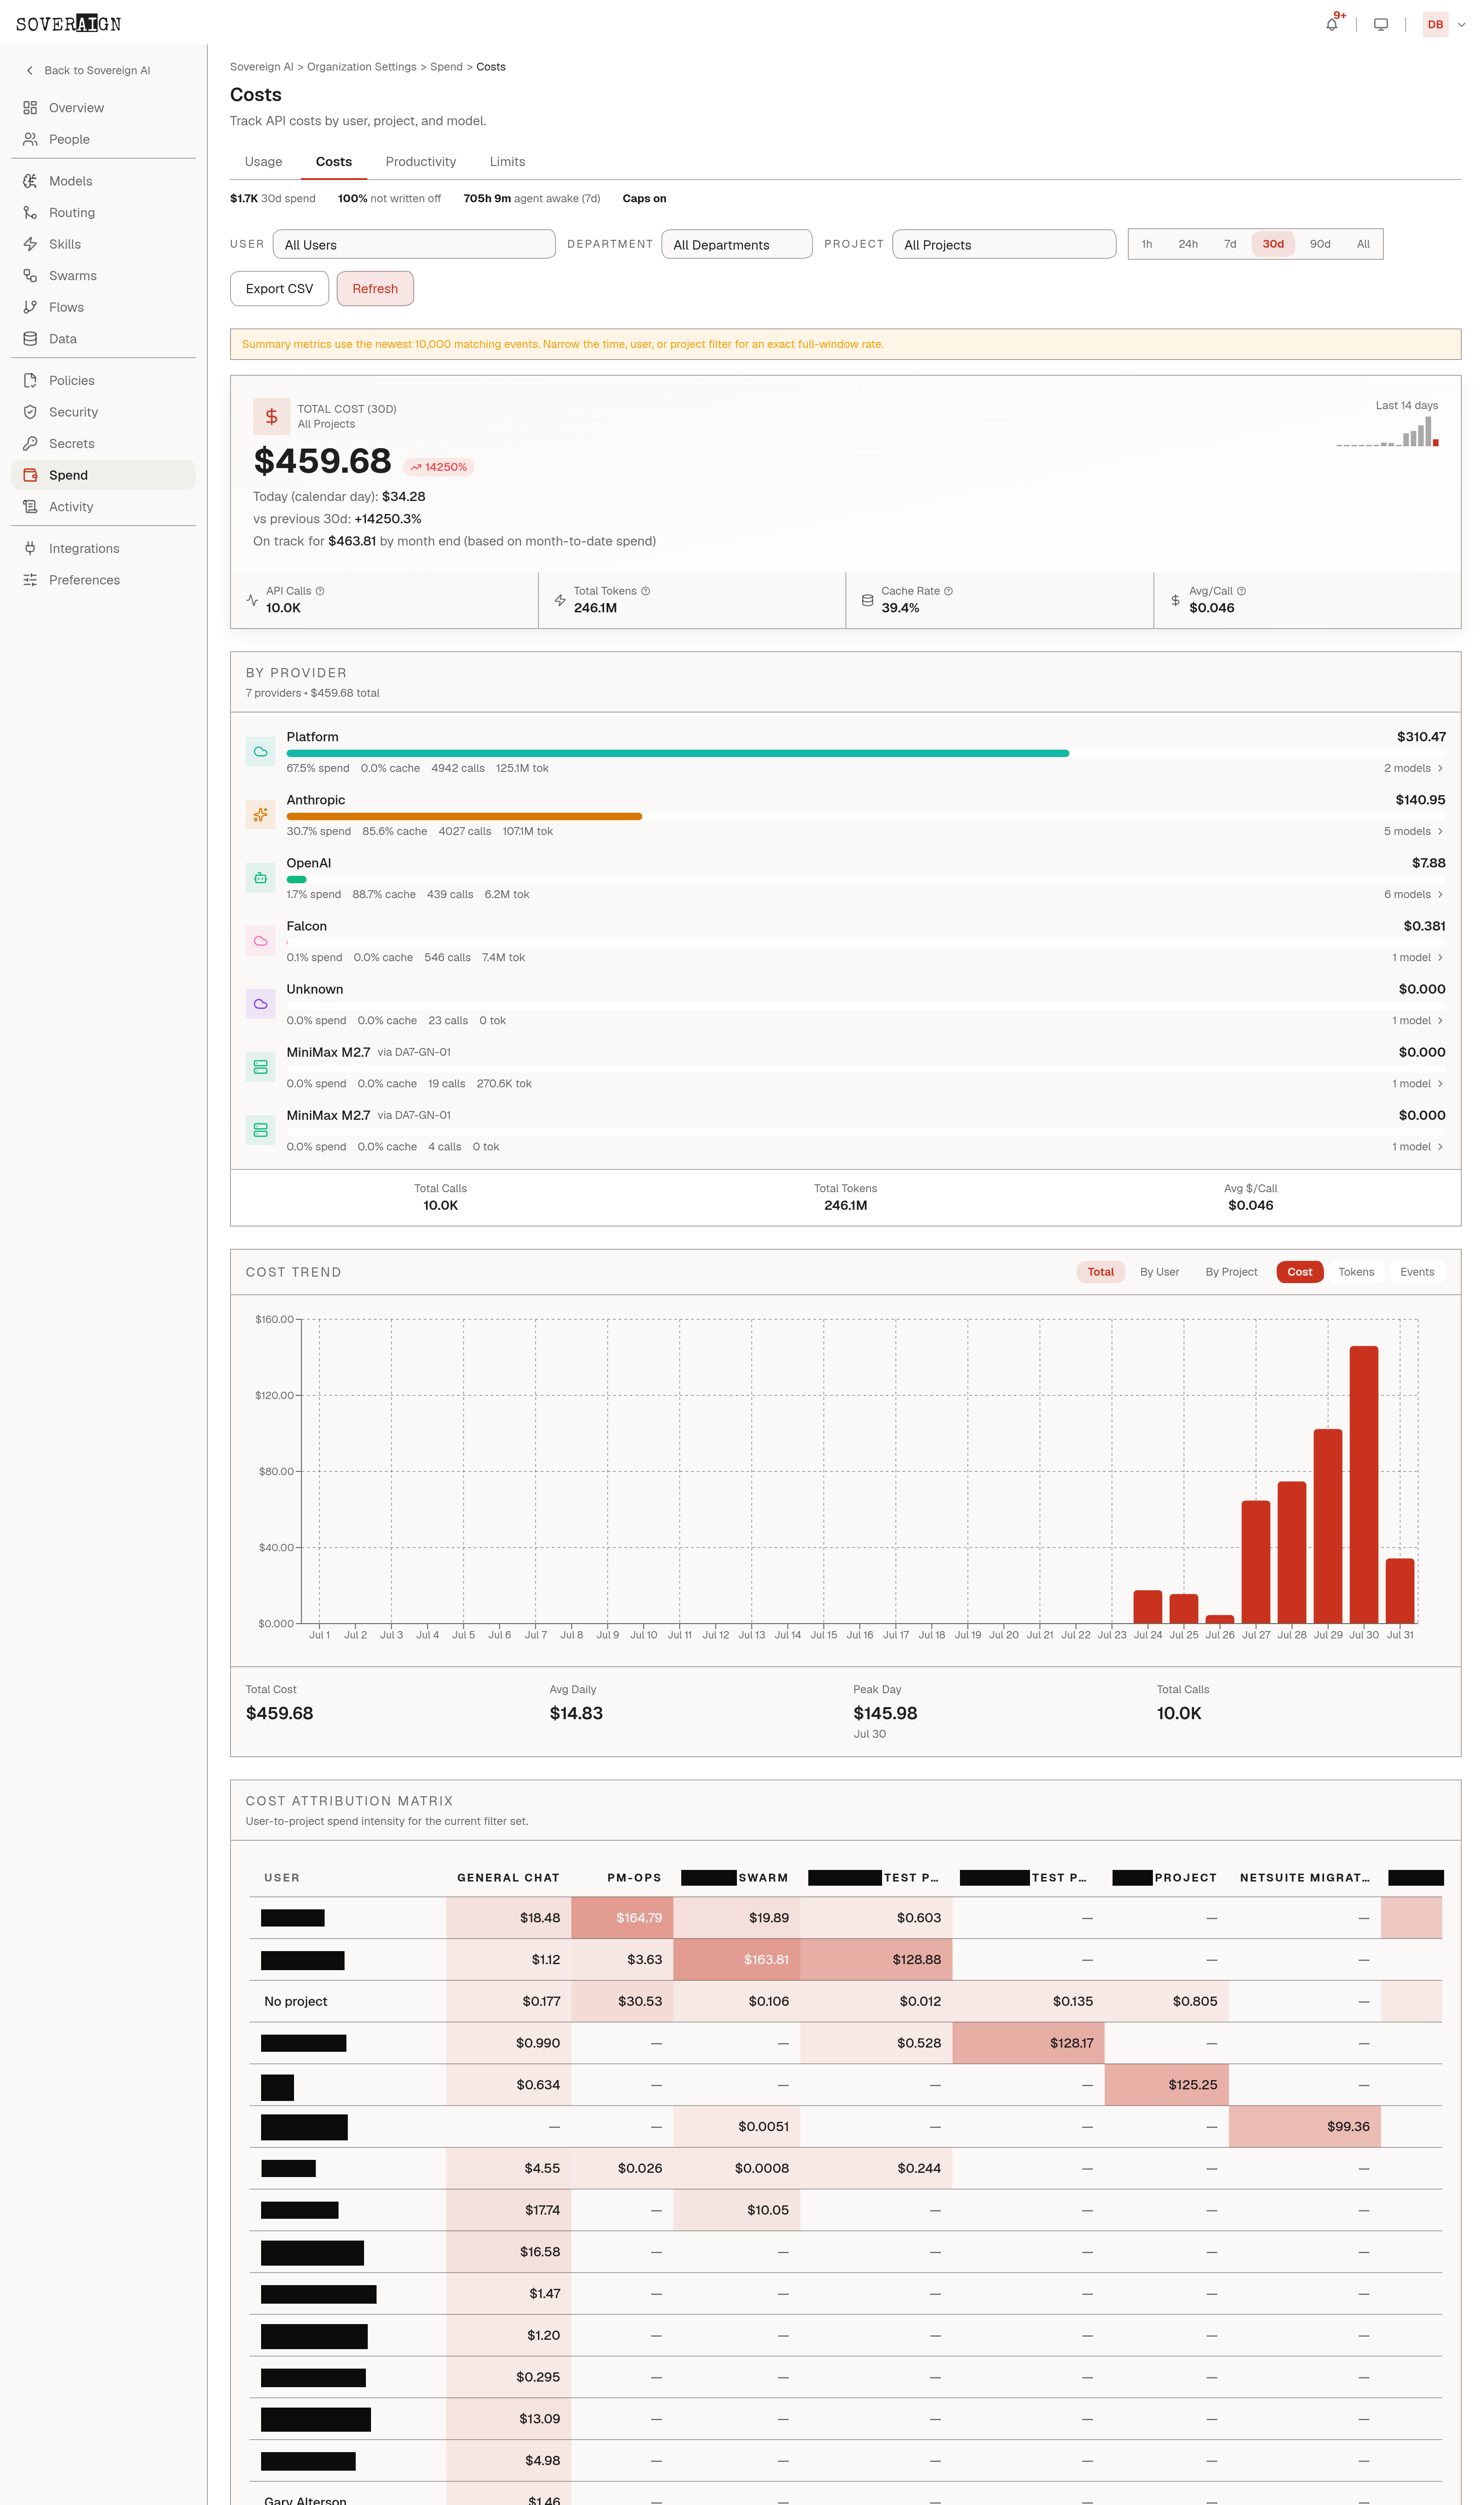
The second tab meters AI tokens. API cost by user, project, model, and flow: pick a time range from 1 hour to 90 days or all time, filter by project or user, and review the trend, the provider breakdown, the cost matrix, the largest individual requests, a month-end forecast built from month-to-date spend, and suggested cost optimizations. Tables export to CSV, and a banner surfaces projects that are over or approaching budget.
How pricing works
Costs and swarm estimates price per million tokens from the live model catalog; a static table backs any model the catalog has not priced, so an unpriced row never zeroes an estimate. Self-hosted models are the deliberate exception: they price at zero because the org runs the hardware, and that zero is kept rather than falling through to an API-rate default. Swarm cost estimates combine catalog pricing with per-role token profiles (an architect, a backend dev, and a code reviewer consume differently).
Productivity: the outcomes lens
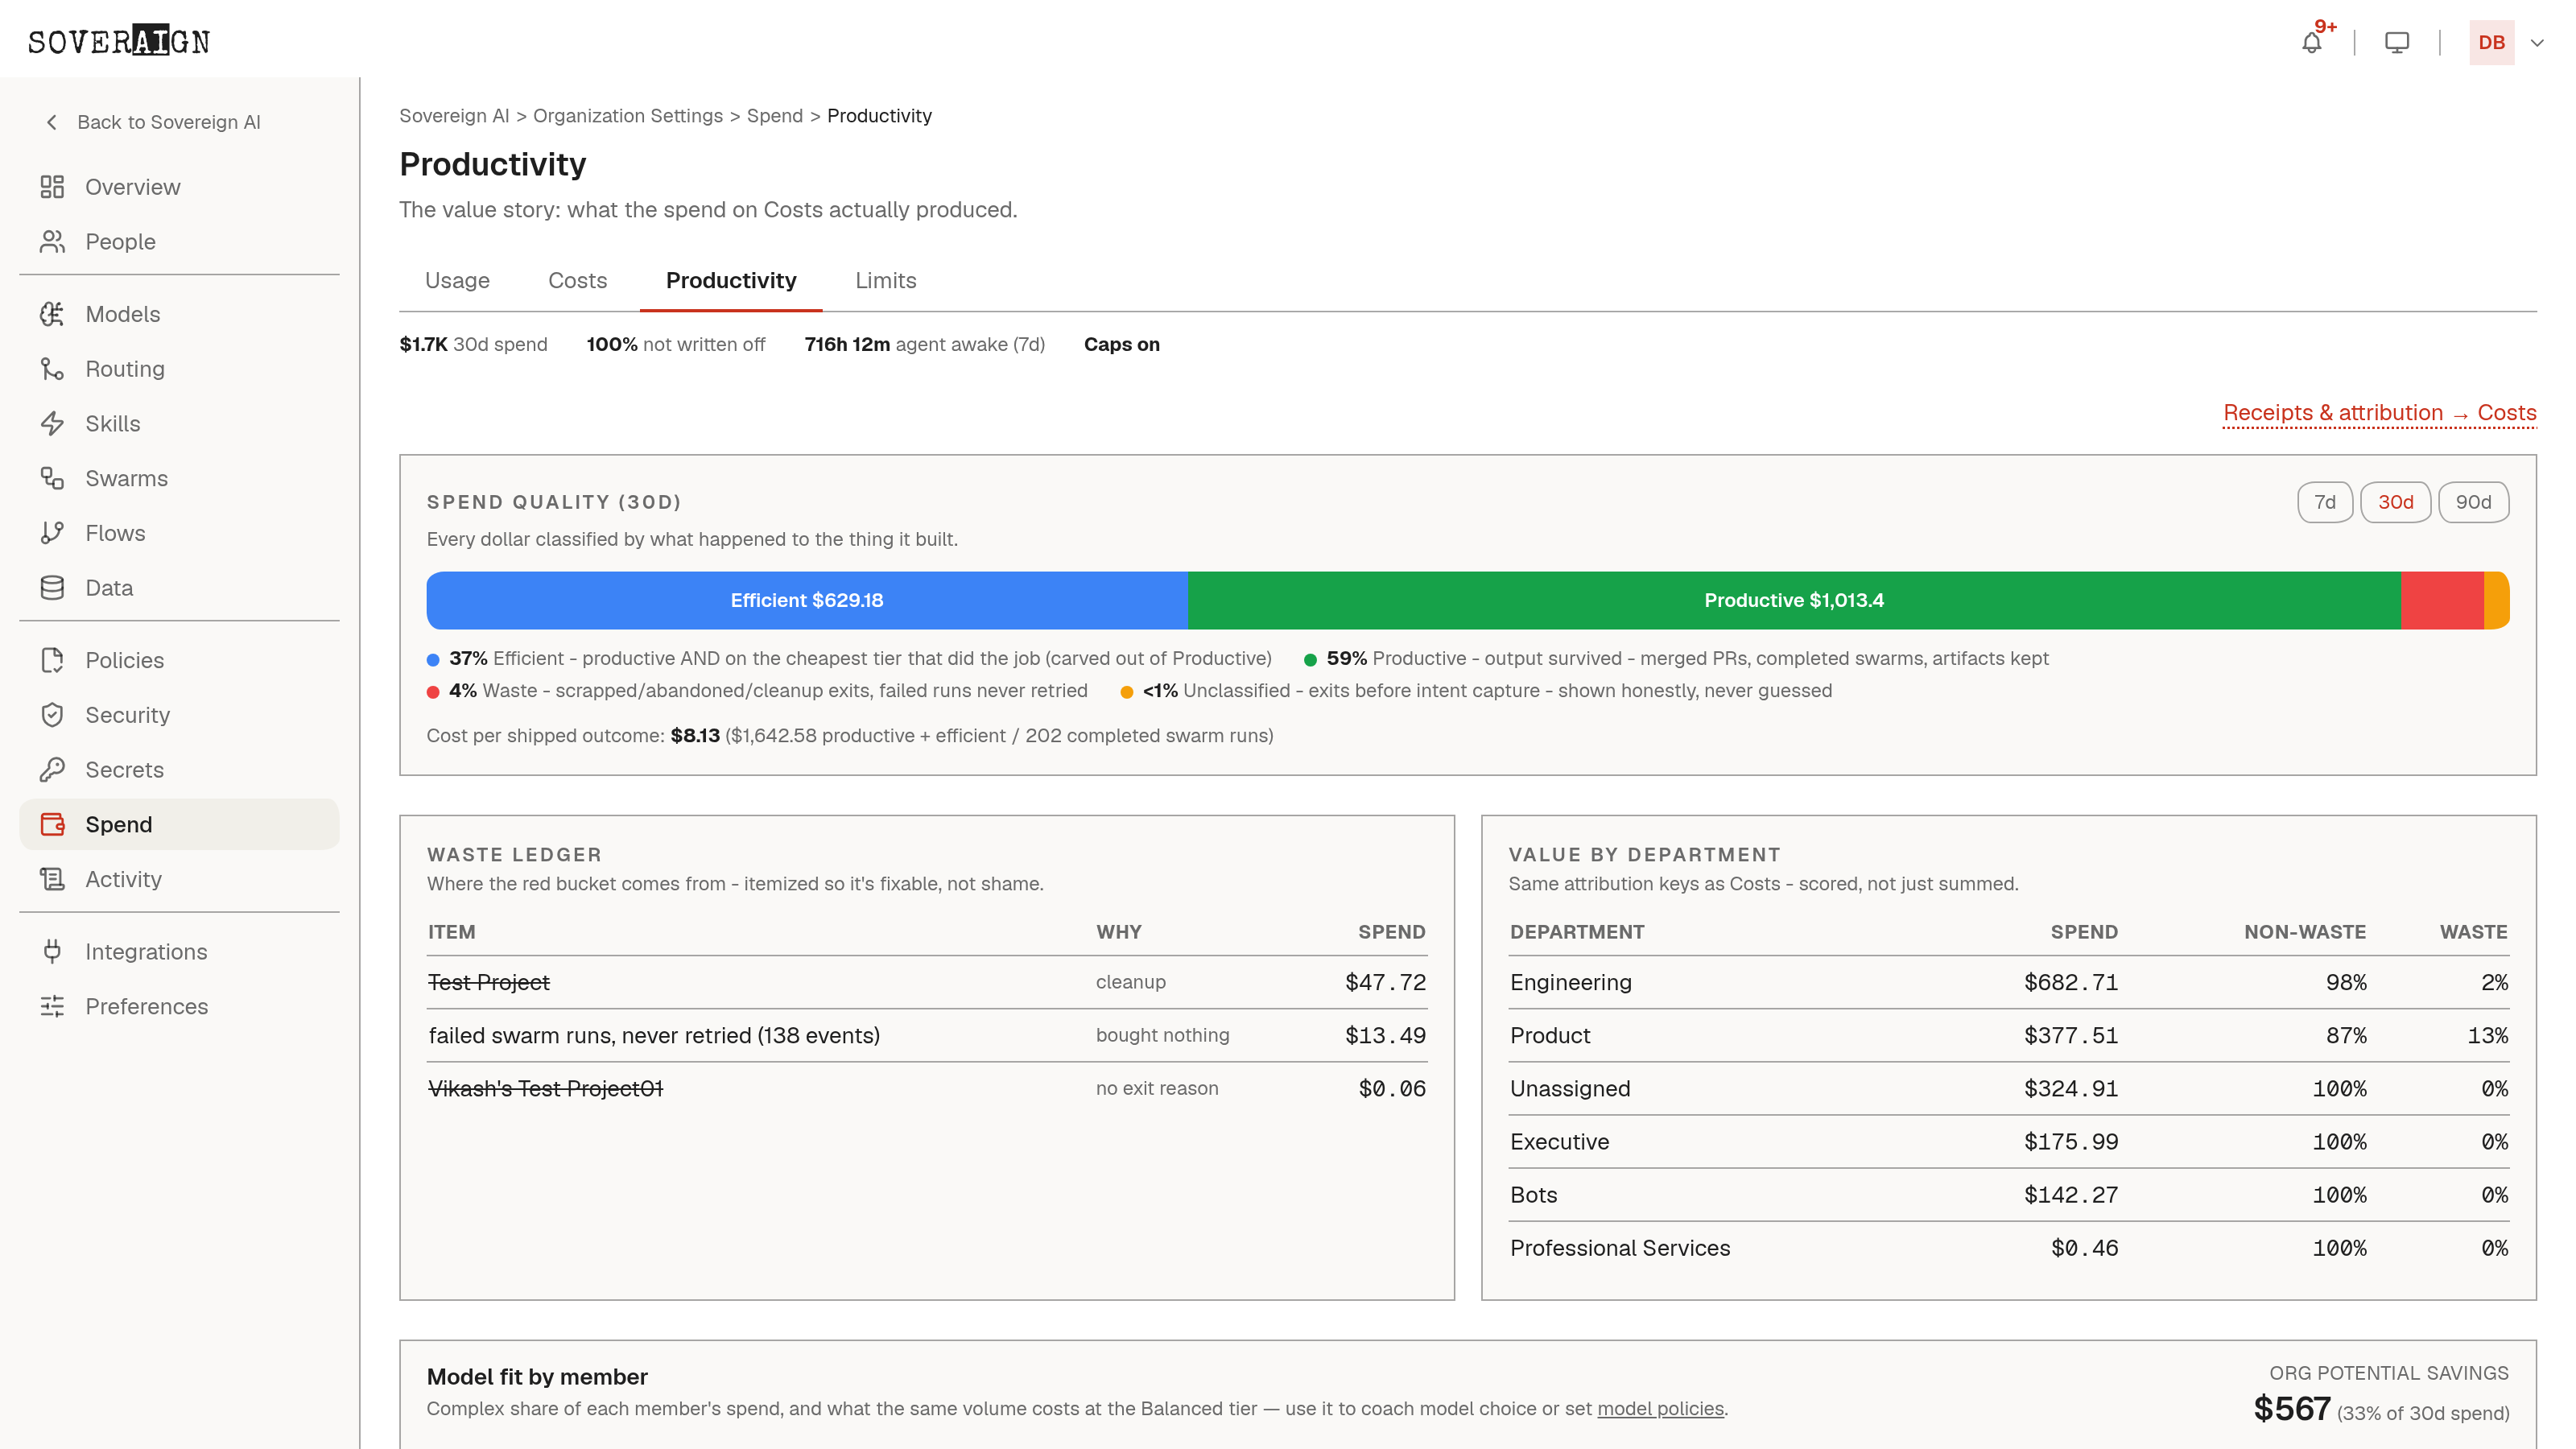
The third tab grades what the spend produced: spend quality (efficient, productive, waste, unclassified), the waste ledger itemizing where the red bucket came from, value by department, and cost per shipped outcome. It gets the full treatment in its own chapter.
Limits: the enforcement
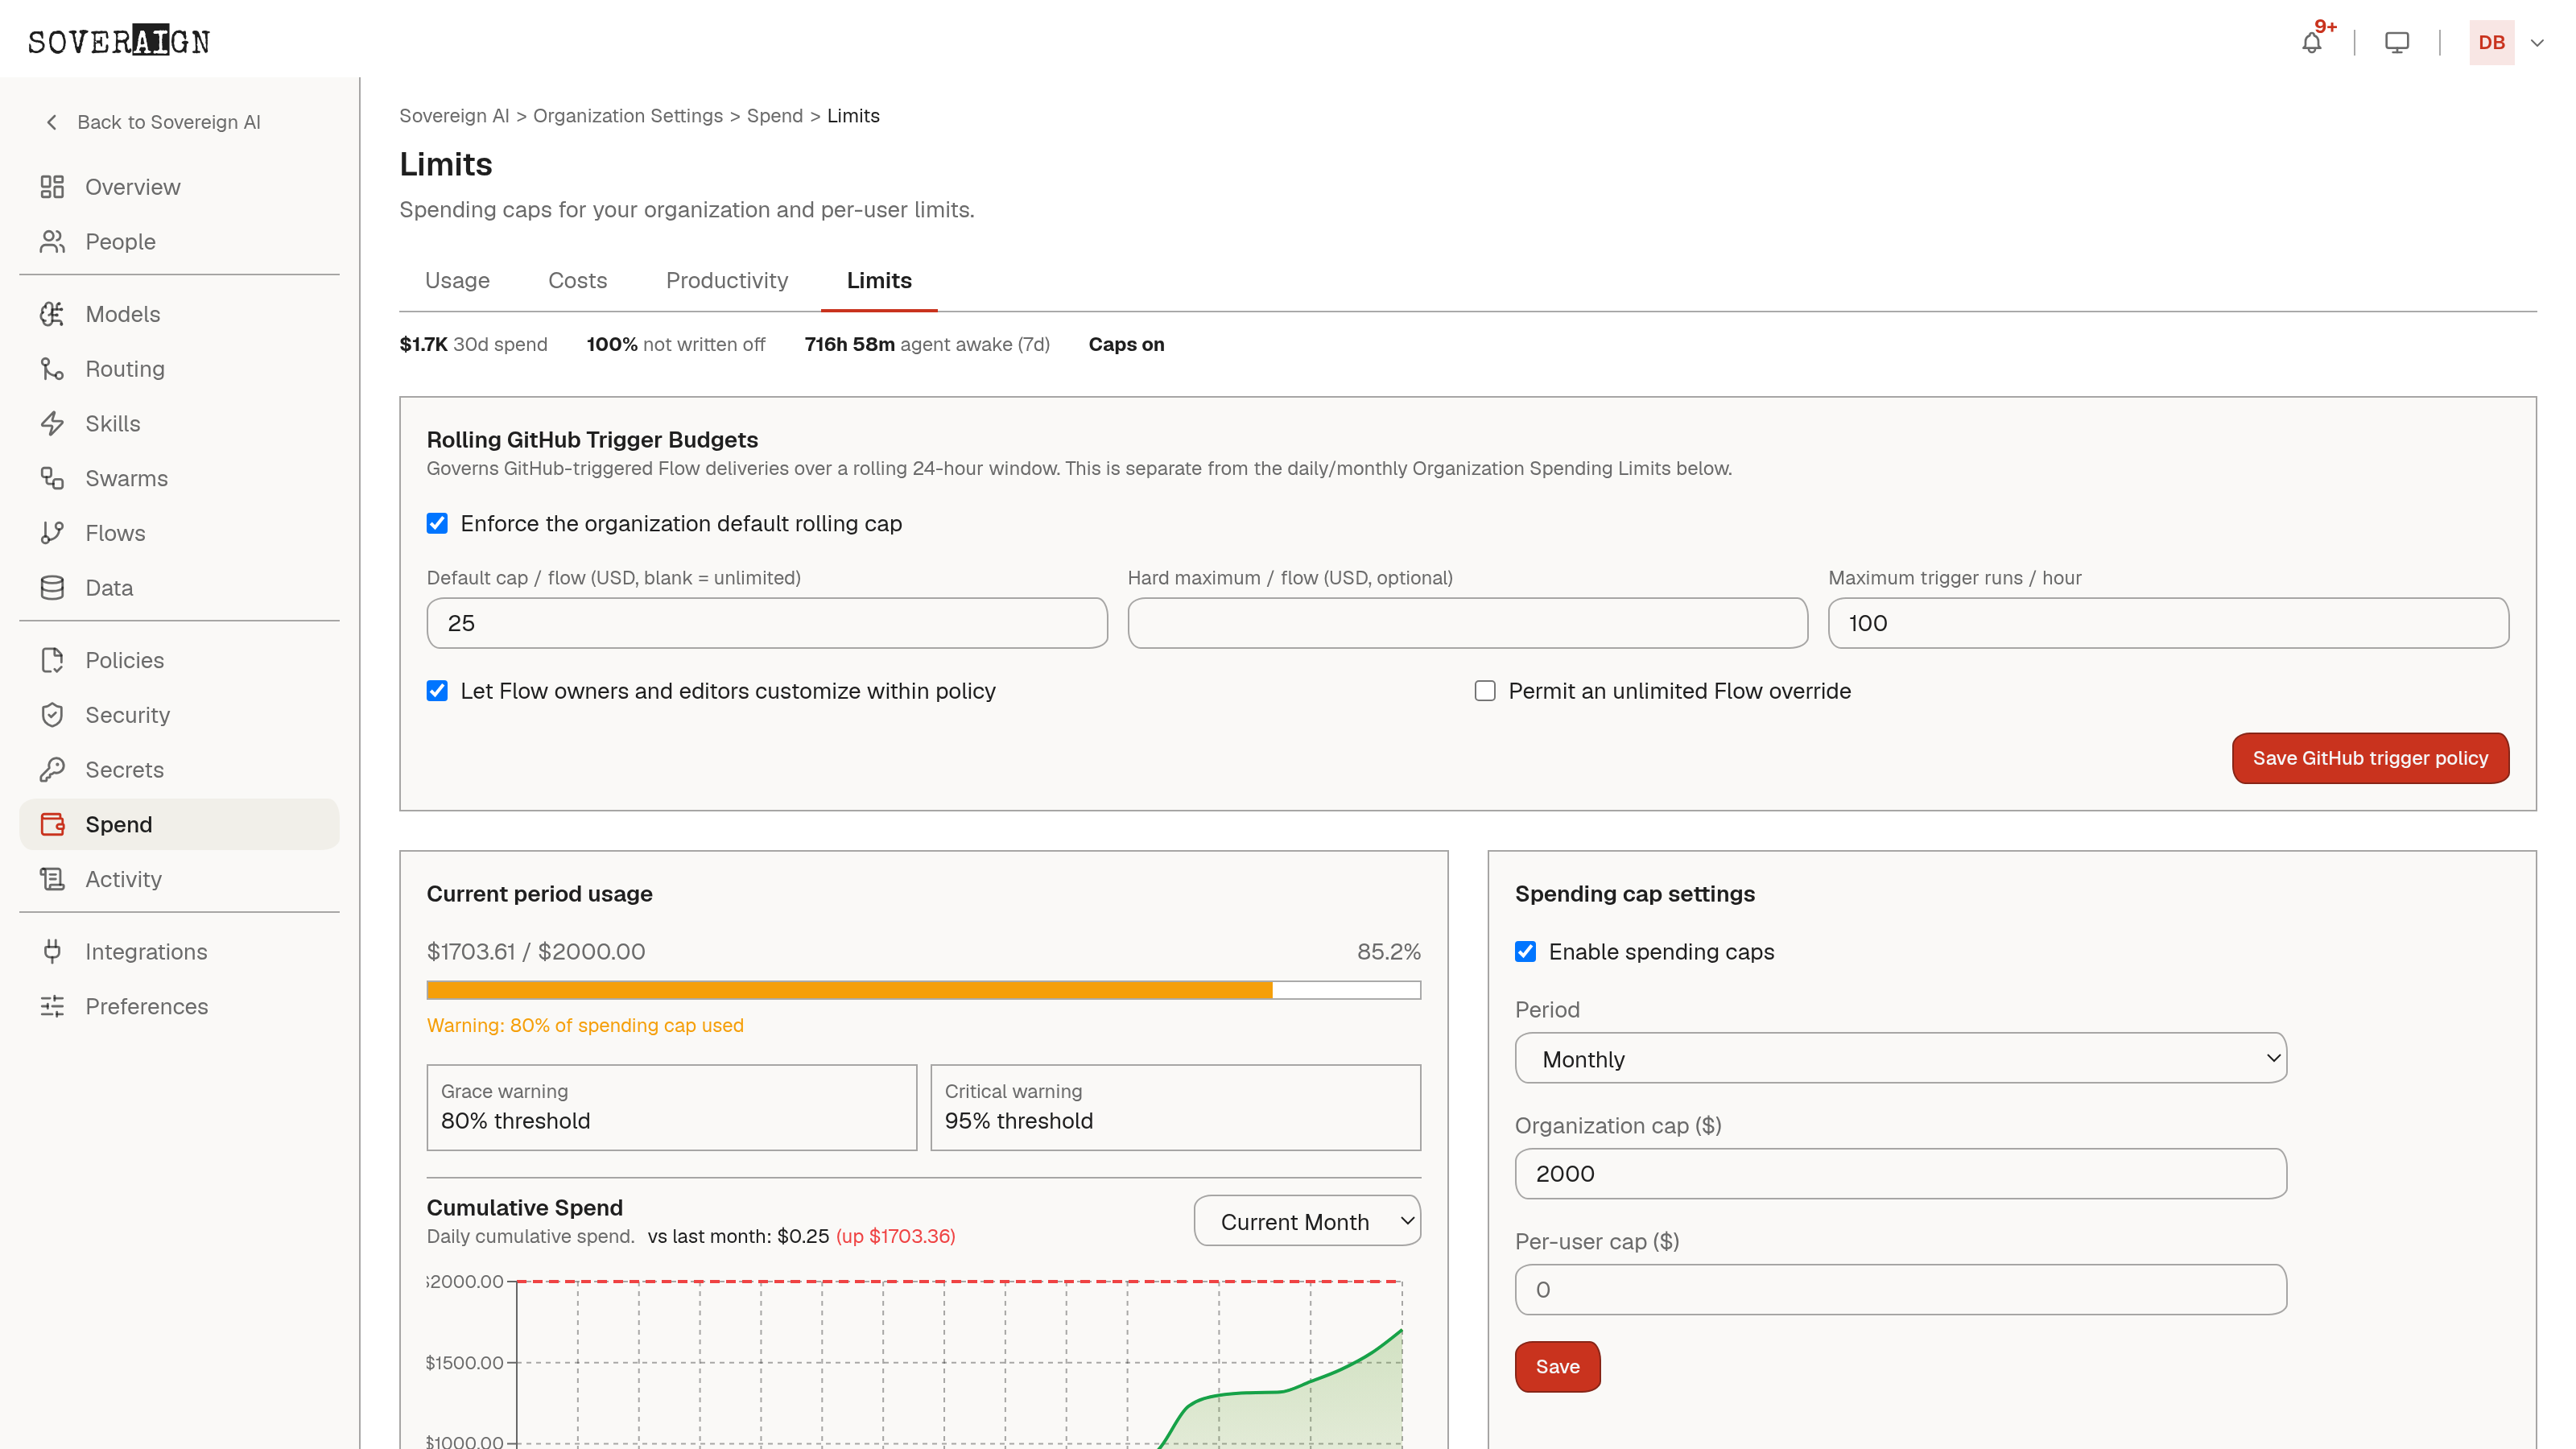
Organization Settings > Spending Limits sets the caps. Enable the cap, choose a daily or monthly period, and set an org-wide cap plus a default per-user cap. You can add finer caps per project, per model, and per flow, and set per-department budgets for the departments defined on the Departments page.
Alerts, requests, and enforcement
Usage bars turn to warning at 80 percent and exceeded at 100 percent of a cap. The alerts feed records every warning and block with the user, usage, and cap at the time. Members who hit a limit can file a cap increase request (org cap, per-user cap, project cap, or model cap); requests land here as pending for an admin to approve or deny.
Cap changes are recorded in the audit trail as spending cap change events, so budget history is reviewable alongside everything else.